
Imagining Data
Virtual Exhibition
Guest Curators:
Ginger Gregg Duggan and Judith Hoos Fox of
c2-curatorsquared
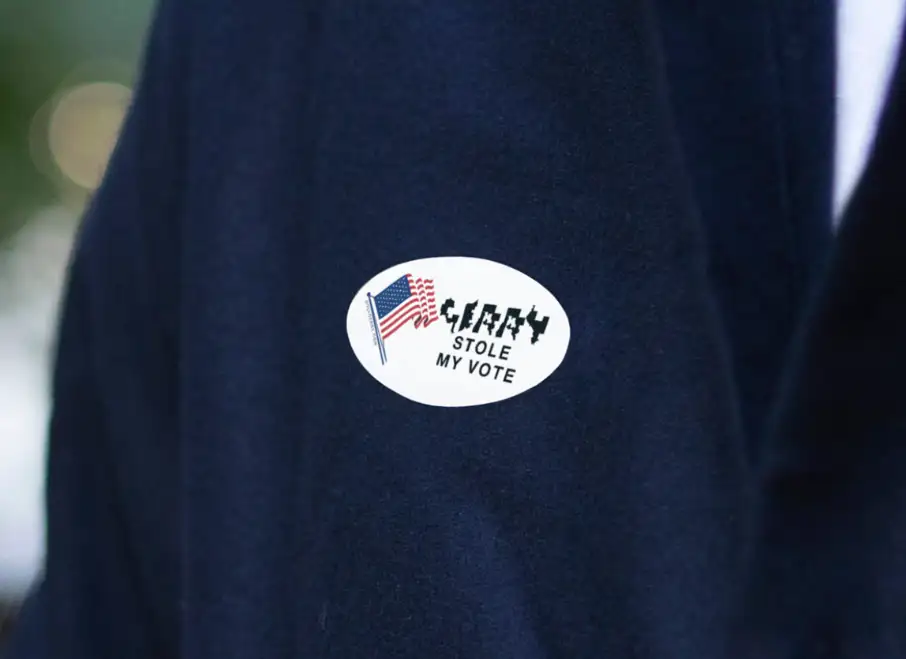
Data has become a buzzword, and a precious commodity—what we divulge through on-line activity is more valuable than the purchases and transactions we may be making. Our phones and computers offer those who are looking a wealth of data of all kinds. And our current status—personal, societal, political, environmental—can be described in terms of numbers and algorithms. Pollsters and statisticians have busied themselves before, during, and now after the US election, gathering and analyzing data on voters, their predicted and projected behaviors. The Covid 19 pandemic has made statistics an international obsession as we follow contagion, spikes, vaccine efficacy rates and hospital capacities. News outlets offer line, bar, pie-chart graphs, lists of percentages, and more. Data visualization is a discipline onto itself.
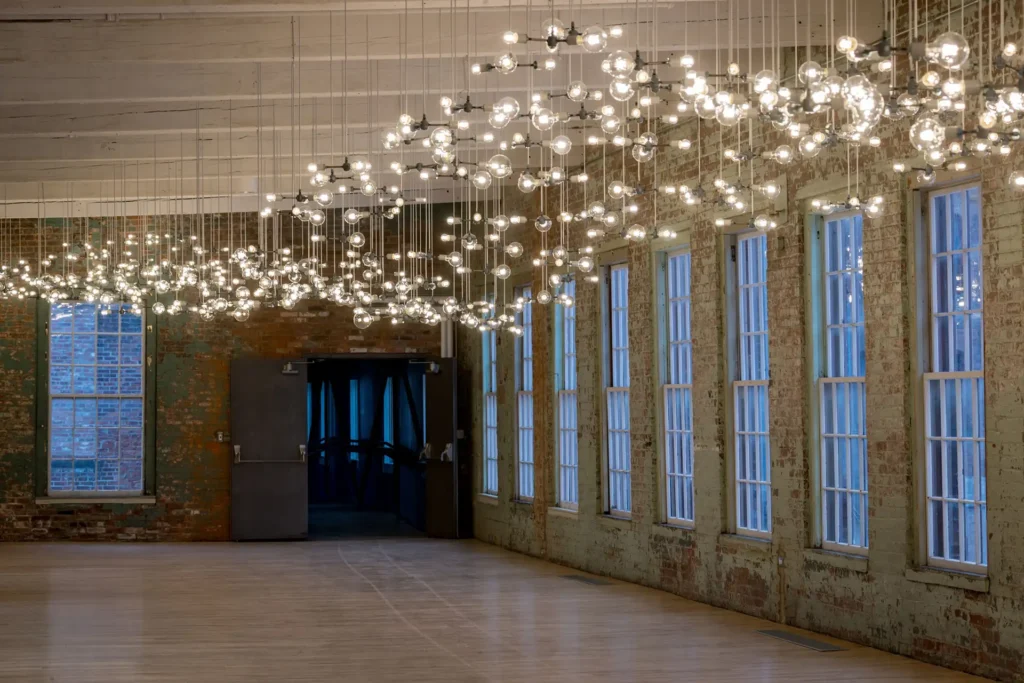
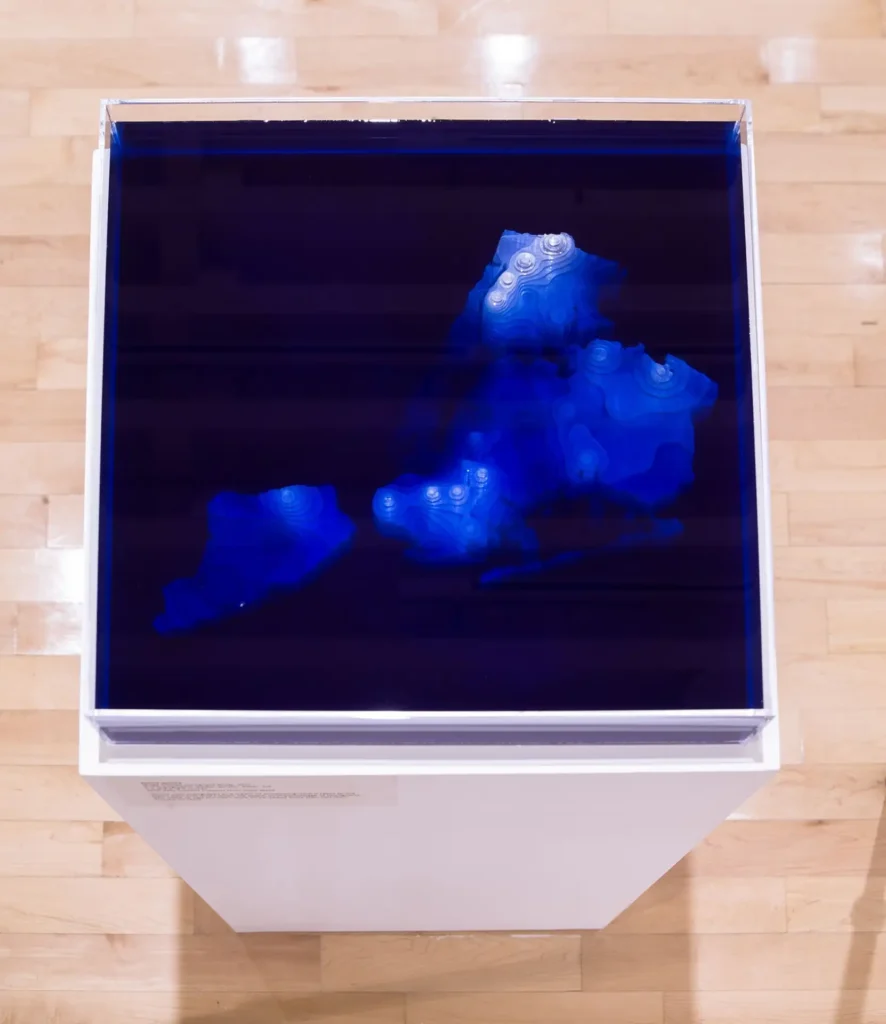
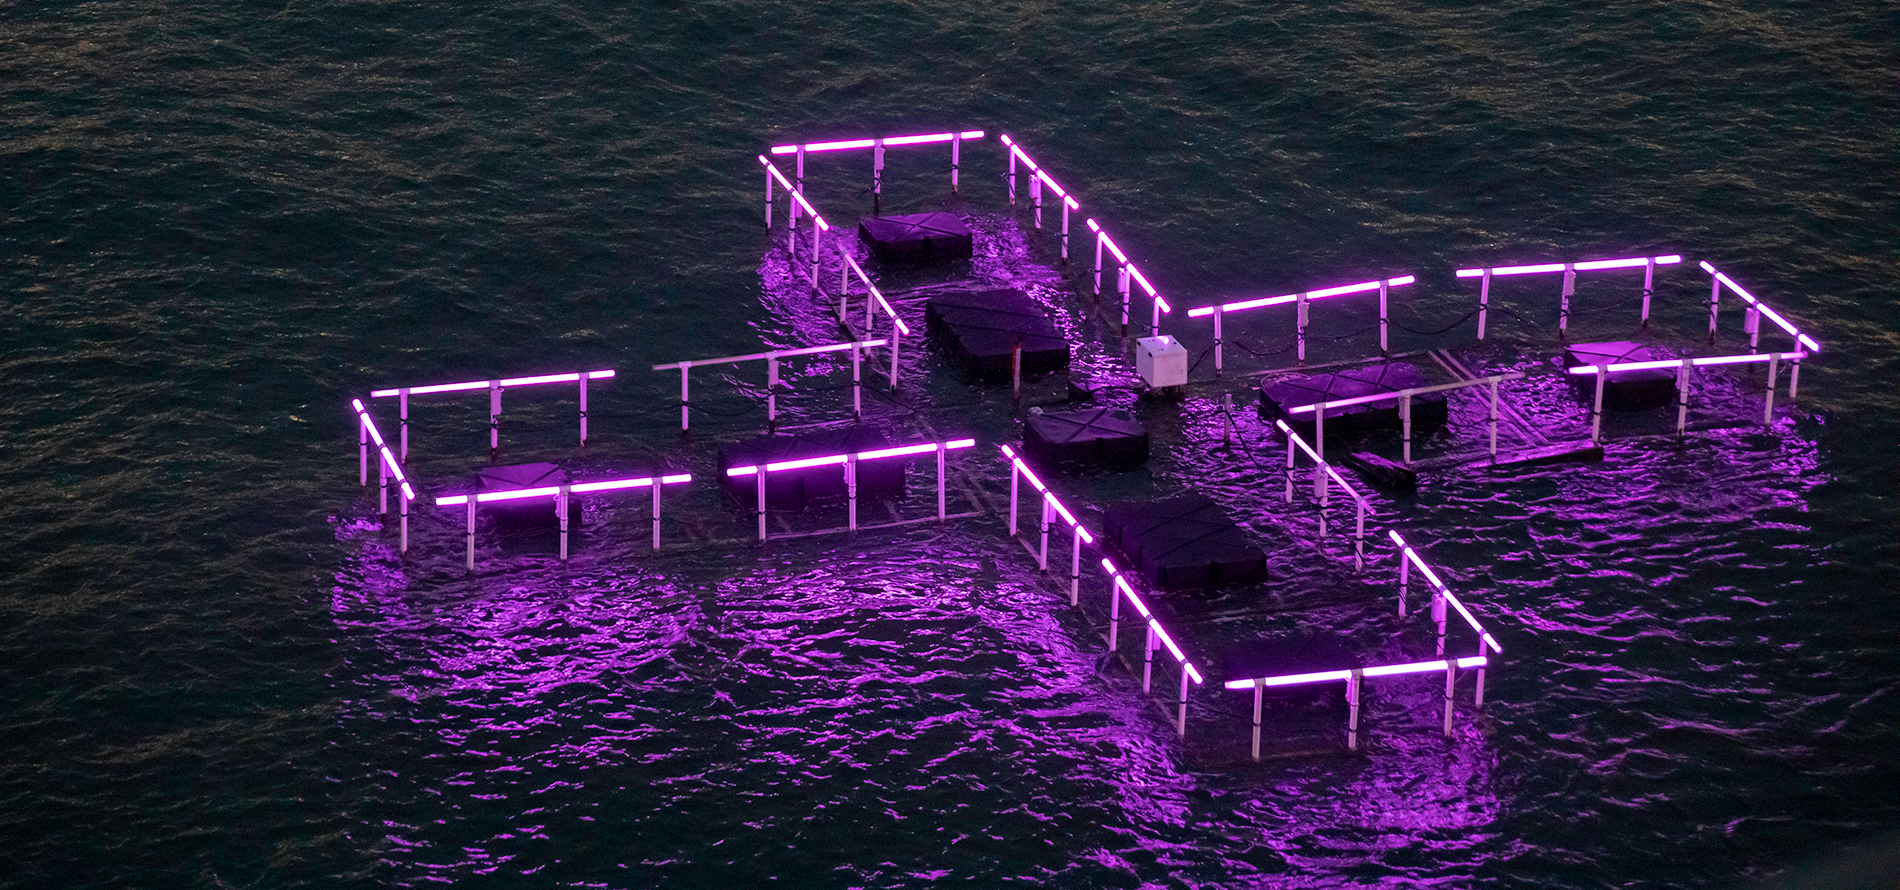
Image: PLAYLAB, INC. and Family New York in collaboration with Floating Point; POOL Light, 2019. Image courtesy of artists.
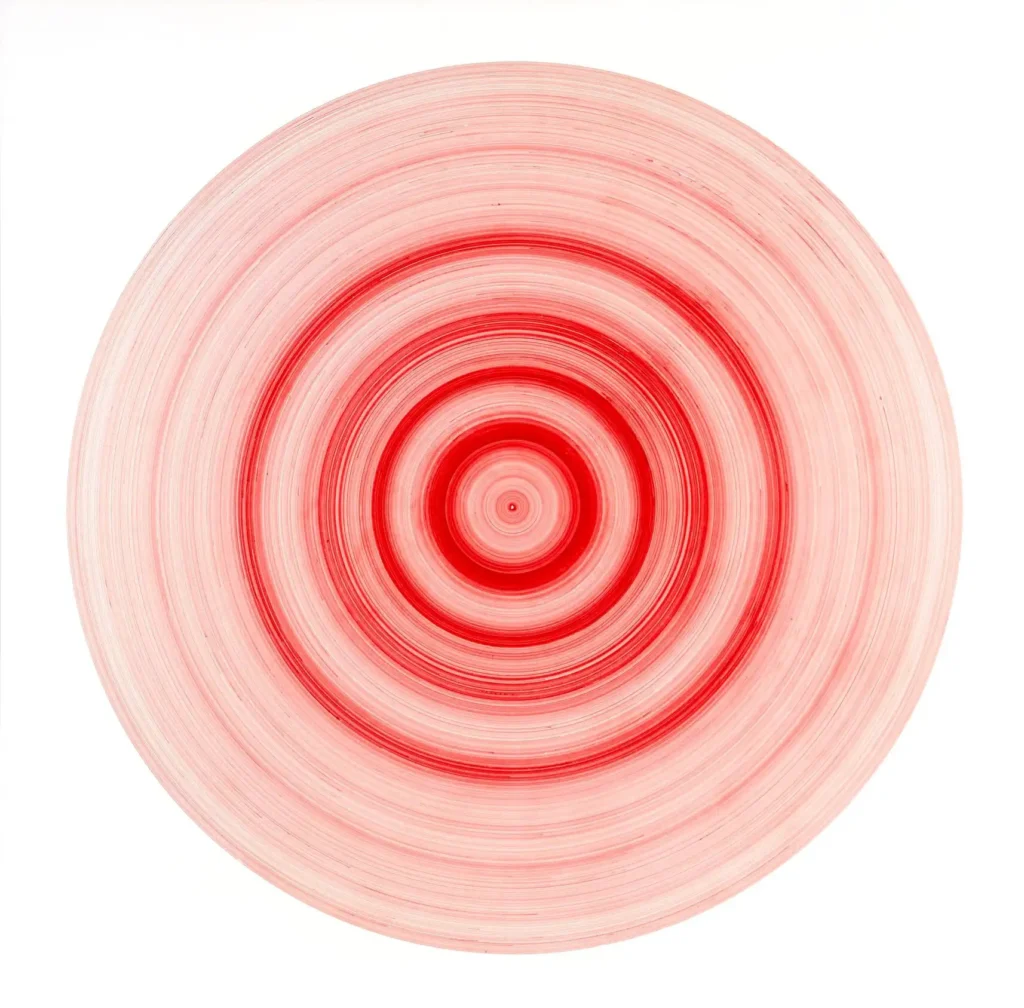
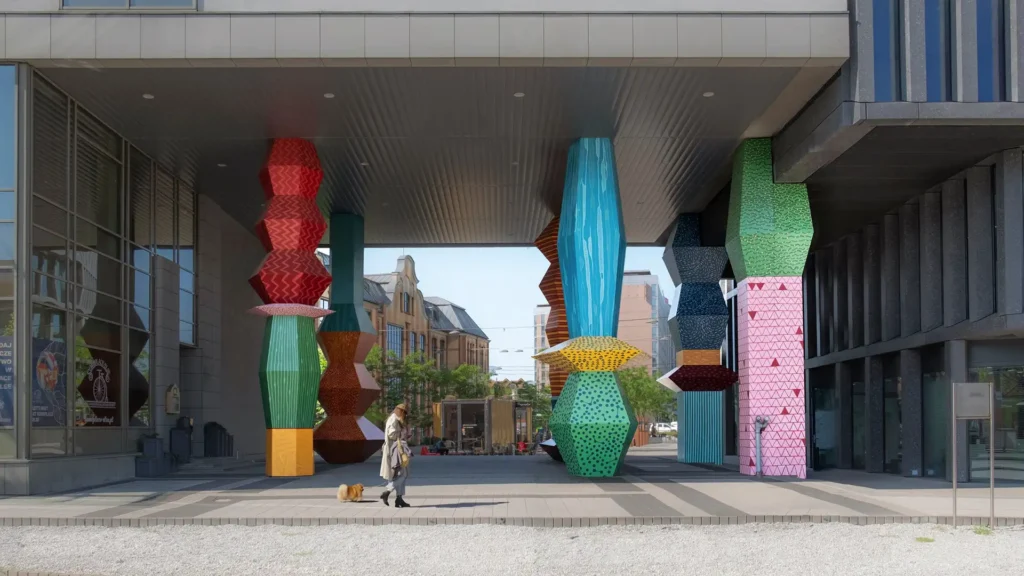
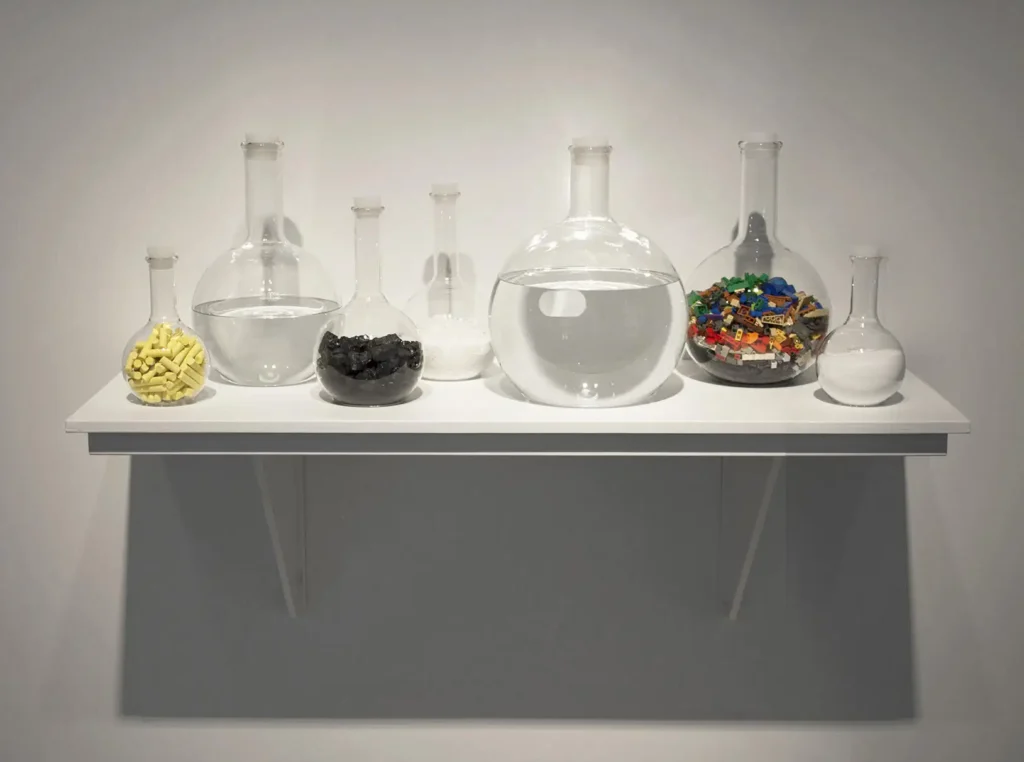
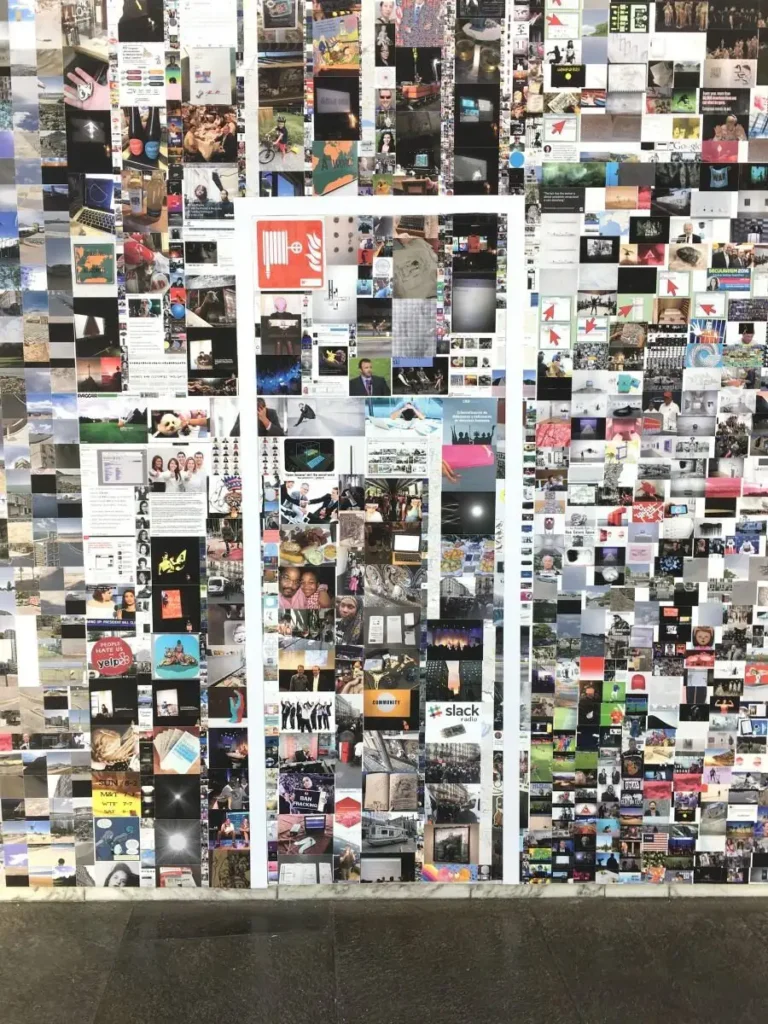
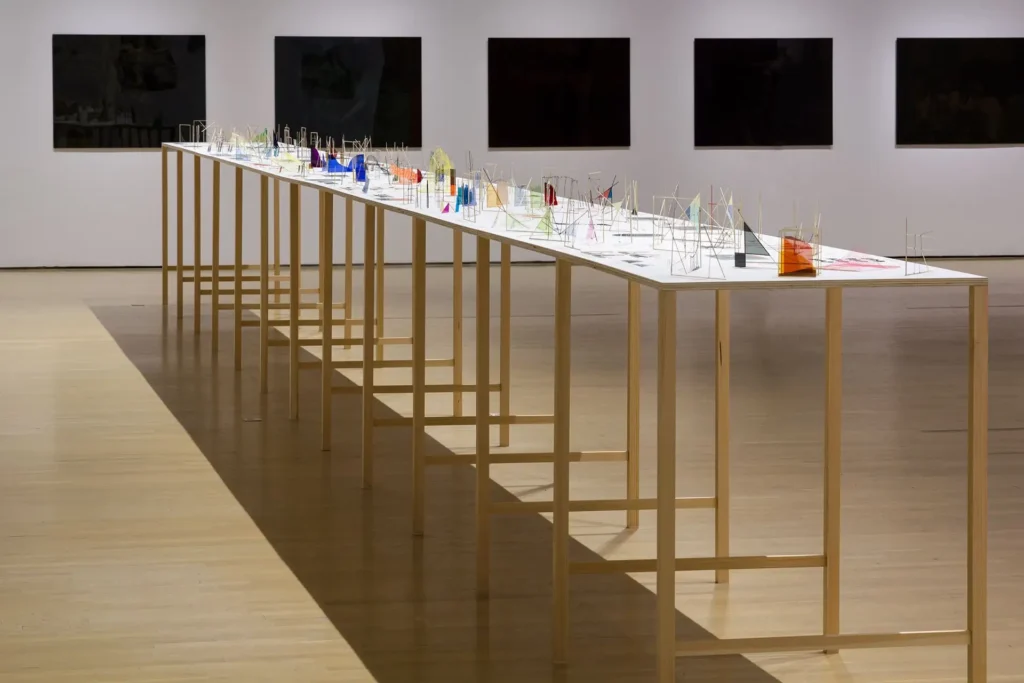
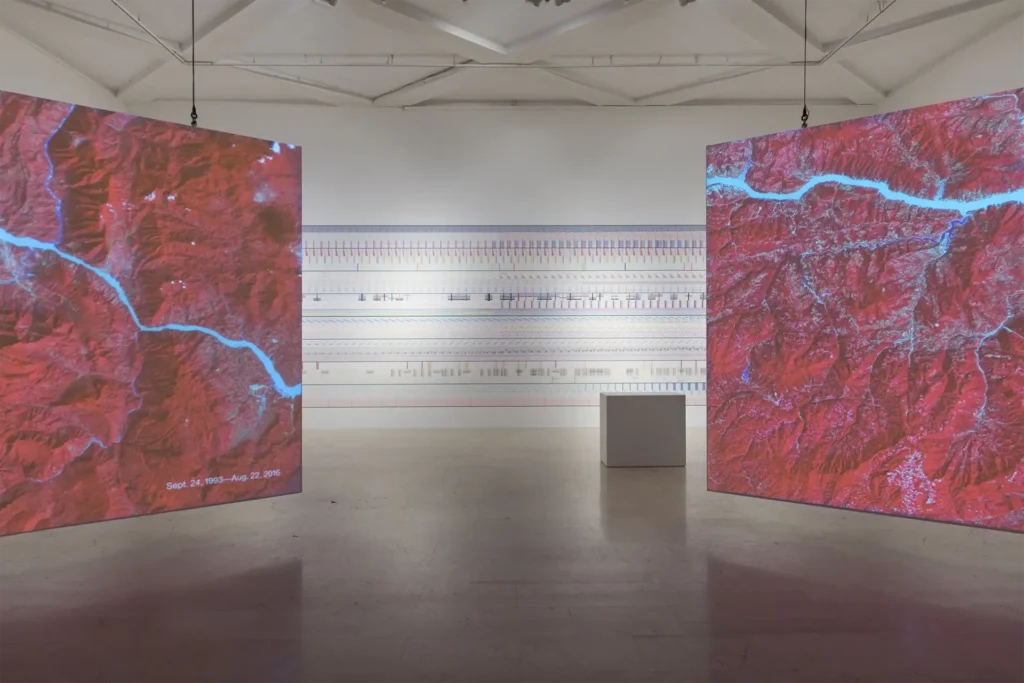
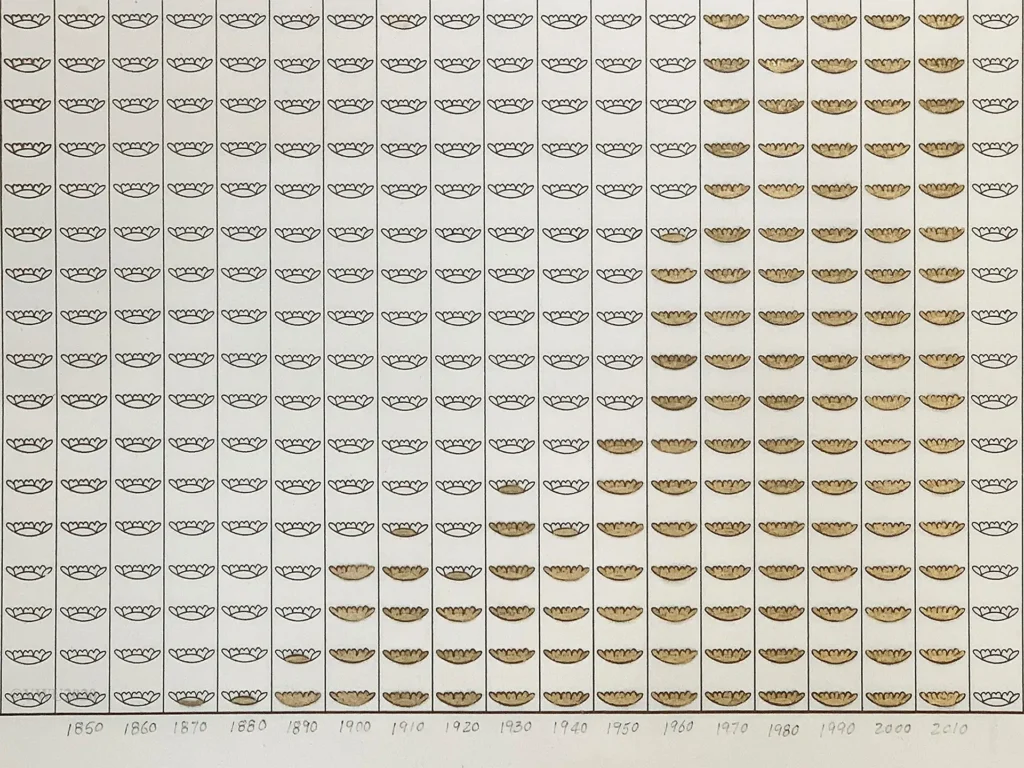
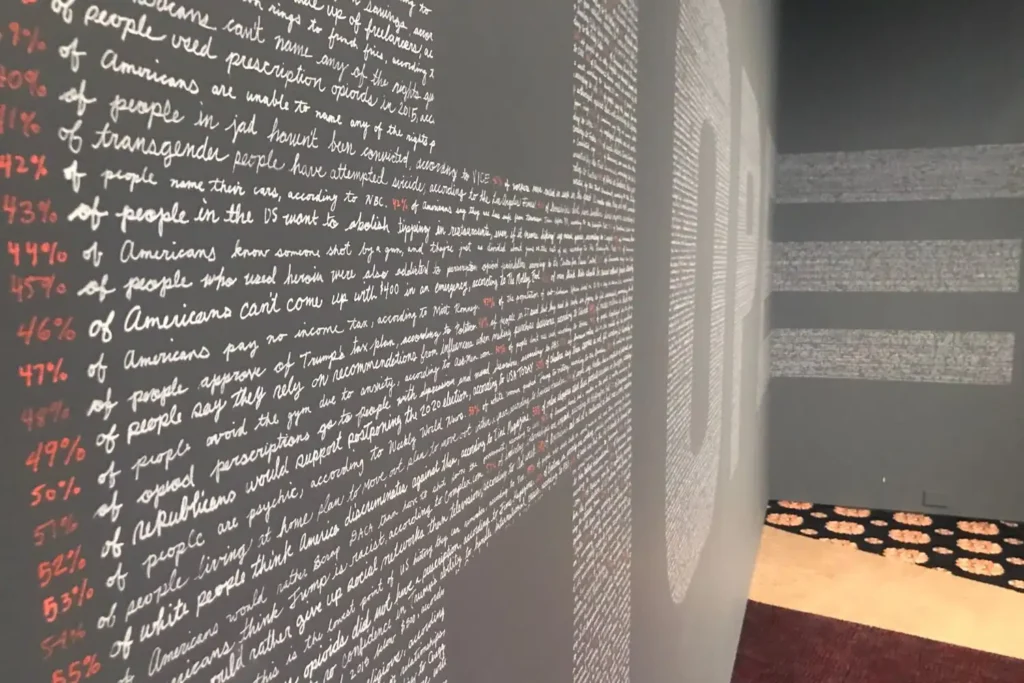
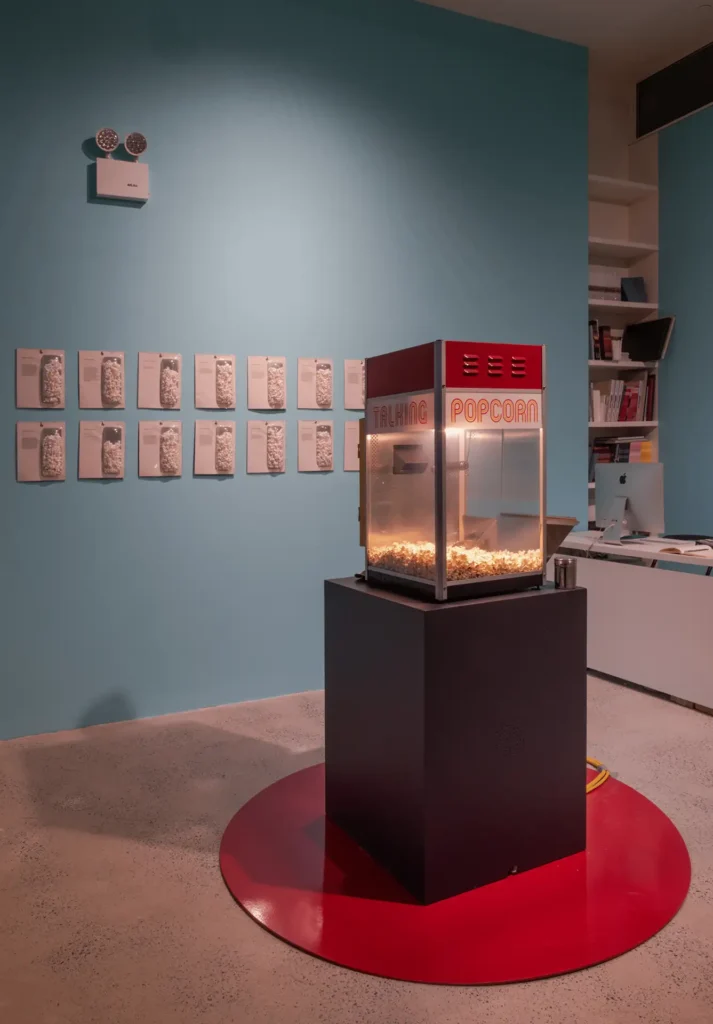
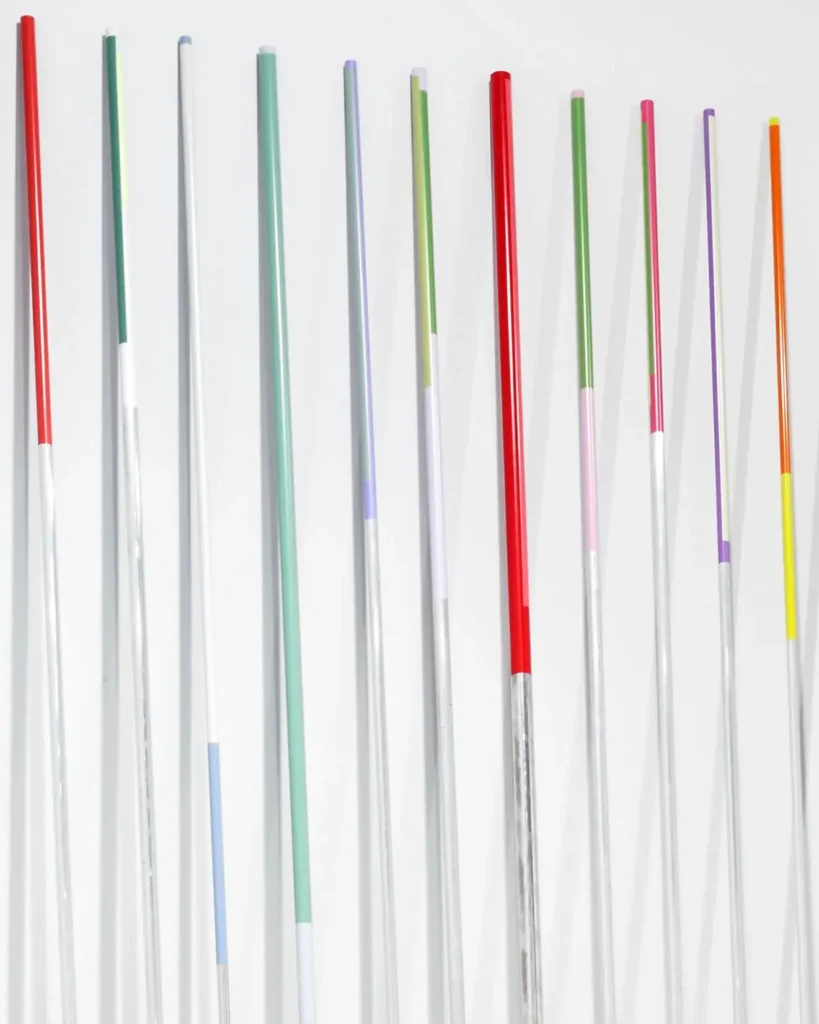
What interests us is the work that artists, around the world, who are showing what data can look like, in paintings, drawings, sculpture, audio-visual installation, fashion and even performance. Some are developing systems to transform data into images, rationalizing the image-making process while creating resonating works of art. Though some of these works are elegantly hard-edged and precise, as one might imagine, many others are remarkably poetic and expressive.
By no means is this a new way to make art. Rationalizing the art-making process has guided image and object making since the middle of the last century. Think Sol LeWitt and Donald Judd. But their systems resulted in their images and objects. Considering chance itself a kind of system may have begun in 1913 with March Duchamp. Remember his Standard Stoppages?
More closely aligned to the work we are seeing now is the work of artists Charles Gaines whose image making is guided by mathematical and numeric systems. This approach matured into his 2007 Greenhouse, a sculptural enclosure whose lights shift according to computer-generated readings of air pollution levels in California. Likewise, Tomàs Saraceno has taken his practice to a planetary scale, dealing with global conditions. Both can be seen as progenitors of this approach—data being the catalyst for image—illustrated in the work we have gathered together for this on-line presentation, Imagining Data.
We are seeing four subject areas that artists are addressing in their data-inspired work.
NATURAL/ENVIRONMENTAL CONDITIONS
In the vein of Charles Gaines’s and Tomàs Saraceno’s work, artists are harvesting data that describes the universe, that records the weather, that monitors environmental conditions. The works in this grouping help us grasp the enormity of the universe and the ever-changing environmental conditions in the atmosphere, to see the shifting power of storms, the cleanliness of water, the rising high water mark in coastal cities. Phenomena too enormous to wrap our minds around become visible in elegant installations, objects, and works on paper.
PERSONAL BIOMETRICS
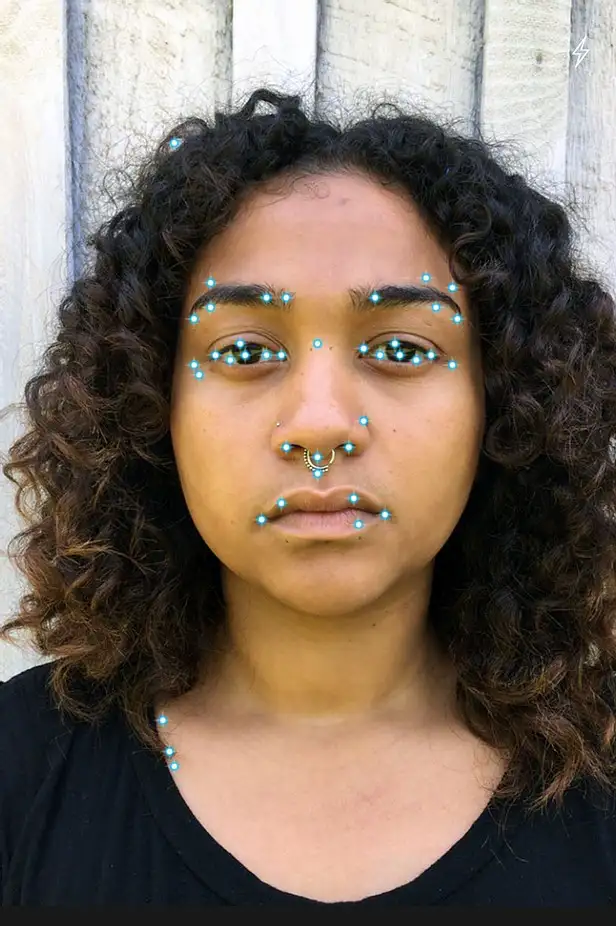
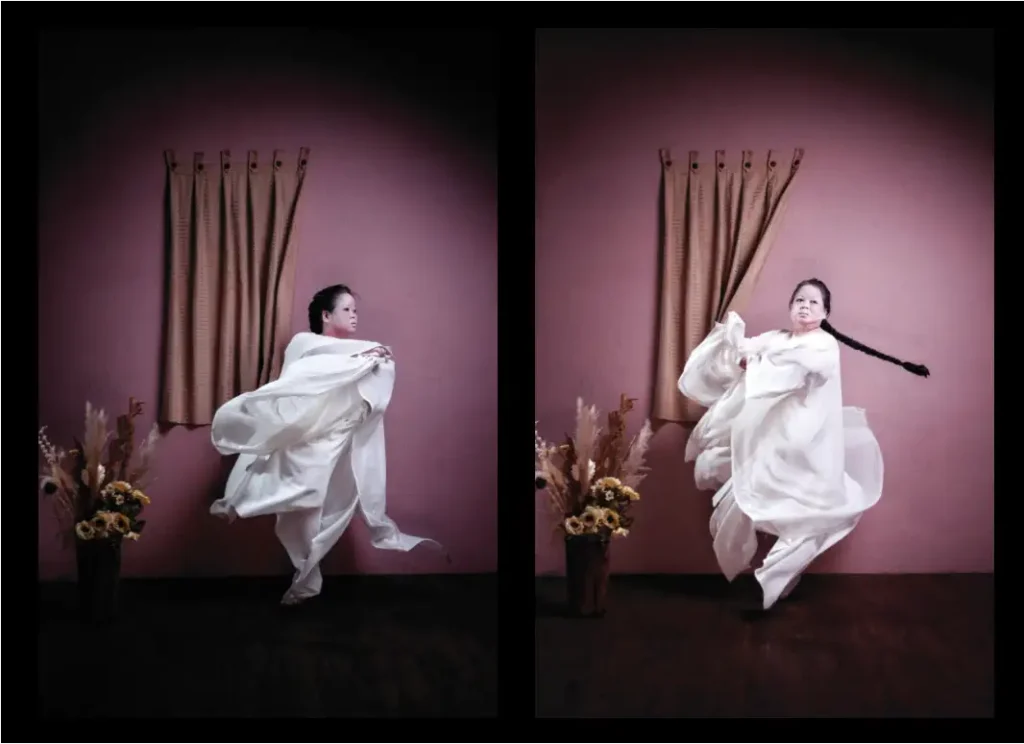
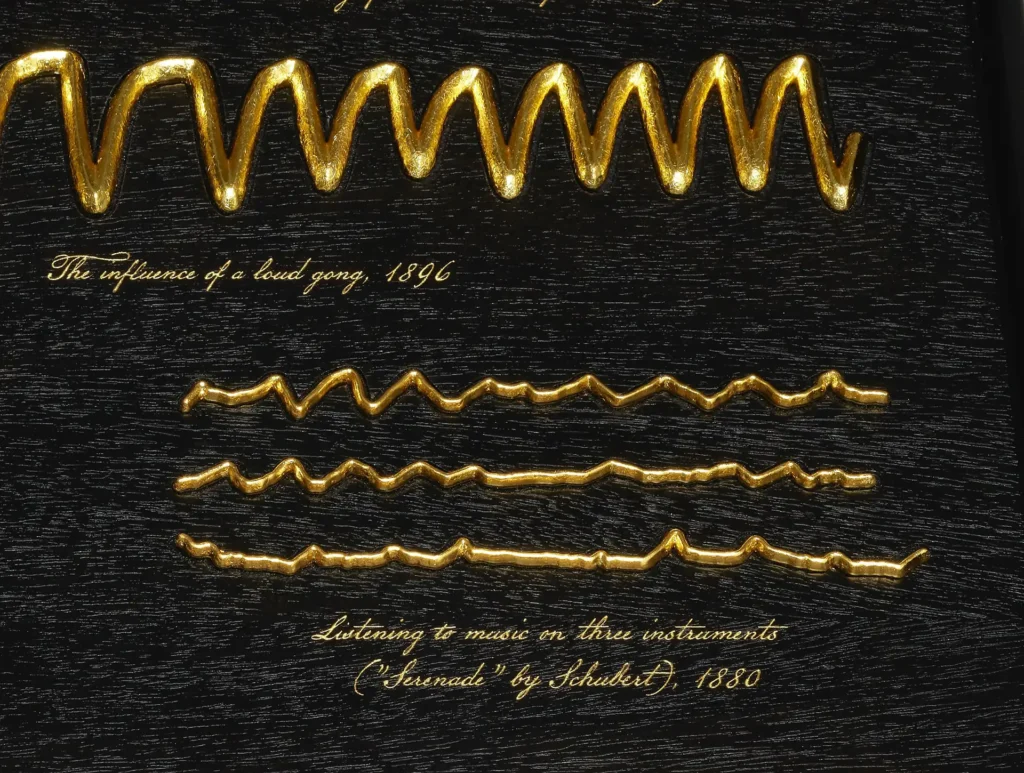
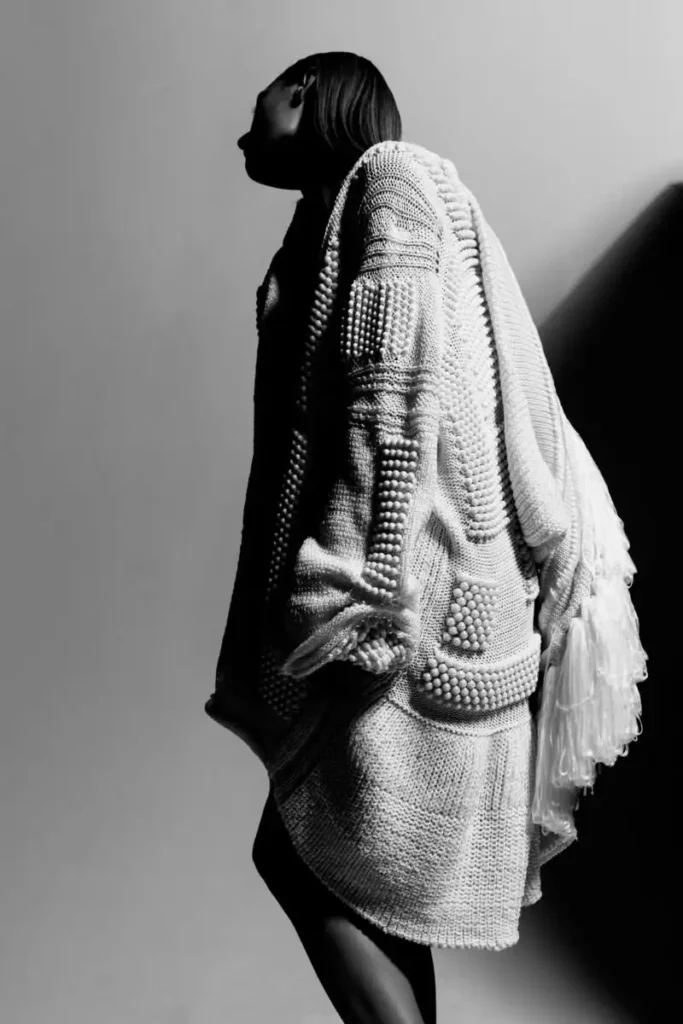
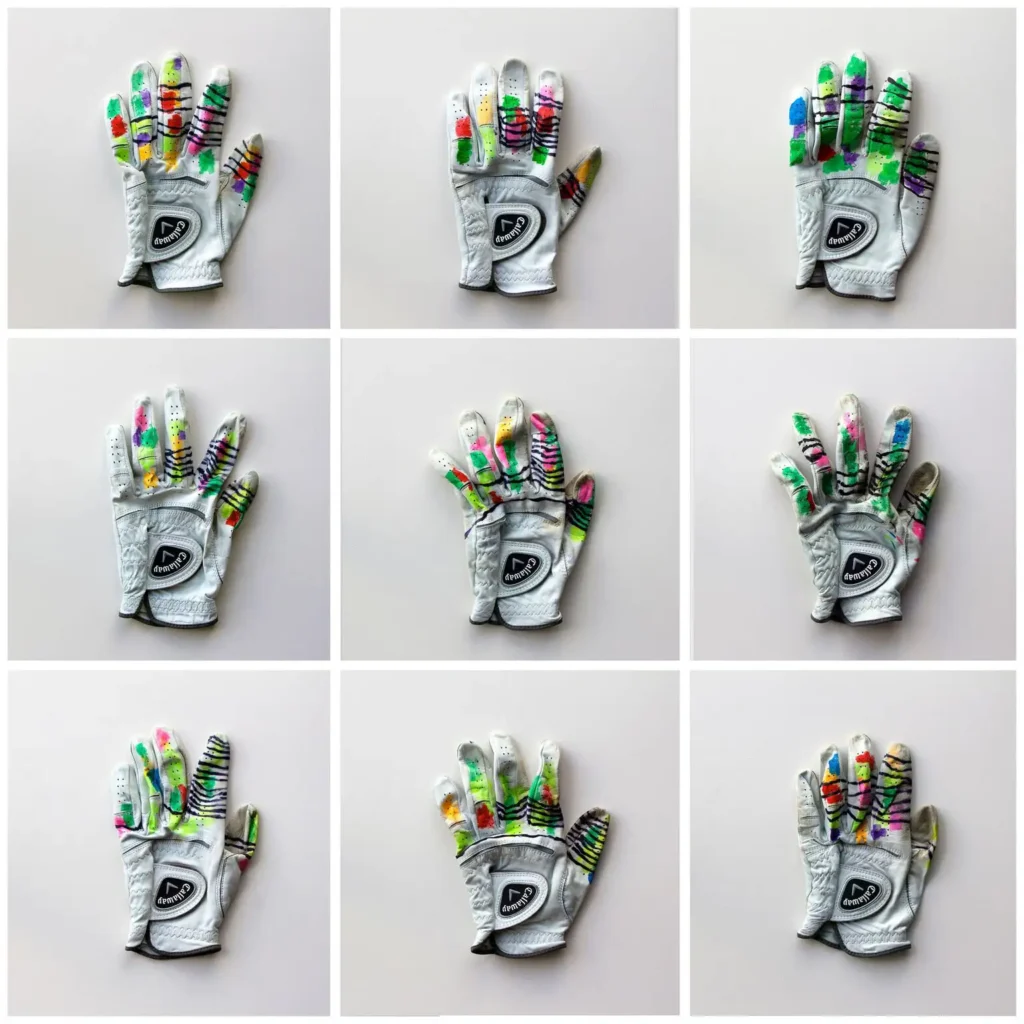
What we are made of, how we look, what we feel, what we dream, how we learn, what we do—these are some of the concepts, all challenging to chart and articulate—that artists have tackled in objects, images, even fashion and performance.
COMMUNAL MOVEMENT
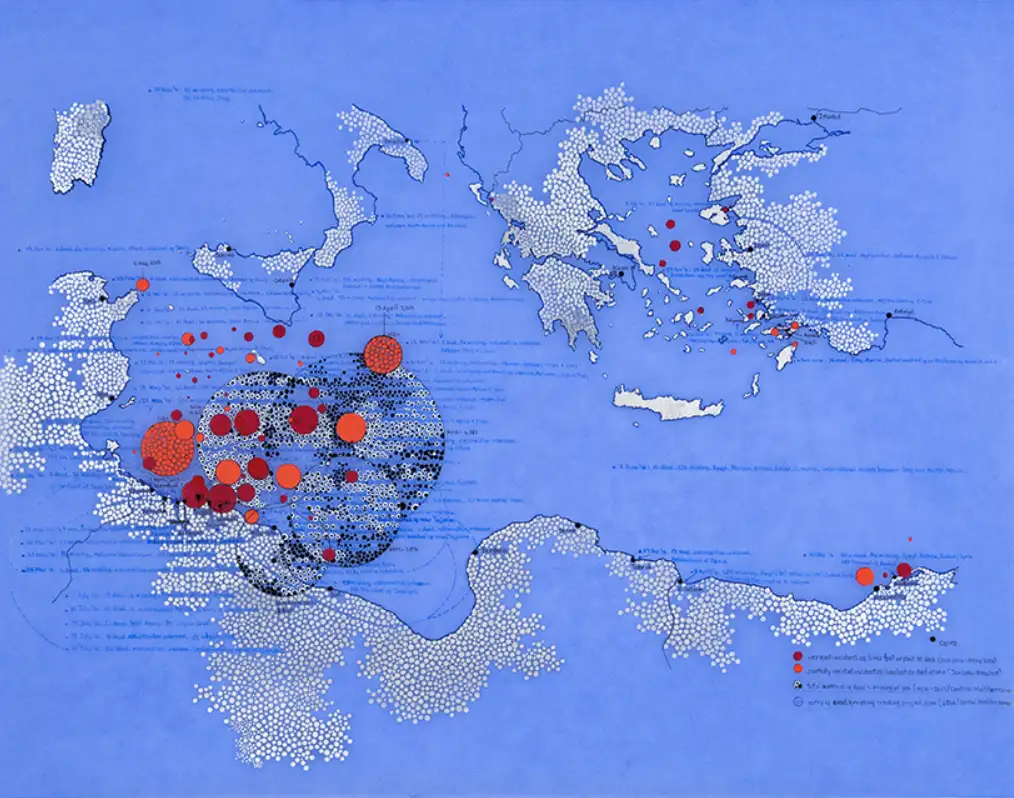
Population shifts, instigated by political policies and economics, can be seen in this group of works on paper, sculpture, and installations. Immigration and migration, mass movements of large sectors of the population over decades and across the world are visualized clearly and elegantly.
RANDOMIZED CONTENT
Seeking patterns and reasons, looking for rationales, that is what our brains like to do when confronted with random events. Chance is random, or is it? Here we find multi-media endeavors, from elegant to hilarious, to explore the unpredictable.
As always, we are grateful to the artists and their representatives whose generosity with providing images and yes, data, made the project possible.


